Pi Network Price Prediction 2026–2030: What the Data Really Says
Pi Network completed its mainnet launch in early 2025 after years in a closed “enclosed mainnet” phase. Since listing, PI has struggled to hold the price levels many early miners expected — as of early 2026 it was trading near $0.20, far below the $1+ predictions that circulated during the network’s growth phase. This article looks at what the data actually supports: where Pi trades today, what the month-by-month projections show for 2026, 2028, and 2030, and the specific conditions that would need to be true for the bullish scenarios to materialise.
Key takeaways
- Current price (early 2026): Pi Network (PI) is trading near $0.20, significantly below early listing hype but holding a functional market.
- 2026 range: Most technical models place PI between $0.14 and $0.25 through 2026, with $0.20 acting as a key support/resistance zone.
- 2028 projection: If adoption grows steadily, models estimate $0.25–$0.35 average, with a ceiling around $0.45–$0.65 in bullish scenarios.
- 2030 projection: Long-range forecasts of $0.80–$1.20 require real utility adoption, sustained exchange listings, and favourable market cycles — none of which are guaranteed.
- The real risk: Pi has one of the largest unverified user bases in crypto, but user counts and active traders are very different metrics. Until token circulation is fully unlocked and real utility is demonstrated, price forecasts carry unusually high uncertainty.
Pi Network (PI) Price Analysis: What the Chart Shows in 2026
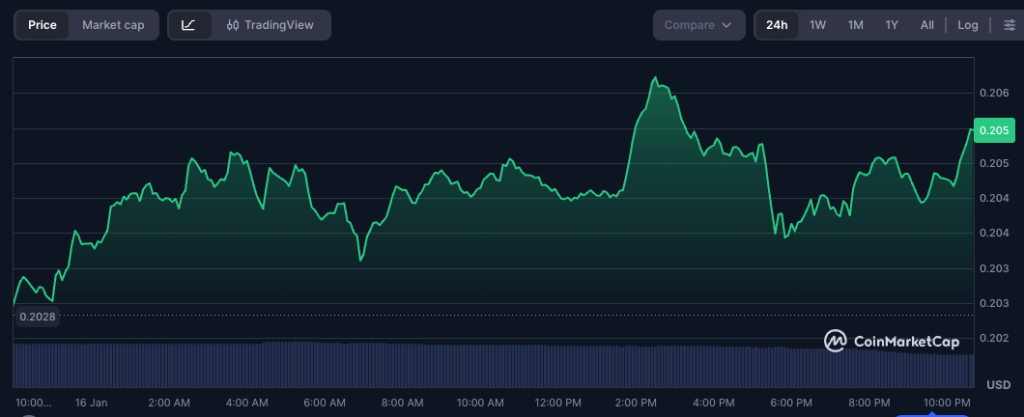
As of January 16, 2026, Pi Network is trading near $0.205, and recent price action shows the market trying to stabilize around this level. Buyers have consistently stepped in just above $0.19–$0.20, which has acted as a short term support zone, while selling pressure tends to appear closer to the $0.23–$0.25 range.
From a trend perspective, Pi’s longer term moving averages are beginning to flatten after a prolonged decline, suggesting the sharp downside momentum has eased. Shorter term averages are slowly turning upward, a sign that buyers are regaining some control, though the trend is still cautious rather than aggressive.
Momentum indicators also reflect this balance. The Relative Strength Index (RSI) is sitting near the middle of its range, showing neither overbought nor oversold conditions. In simple terms, the market is waiting for a clear catalyst before making a strong move in either direction.
On the fundamentals side, Pi Network continues to benefit from a large user base and ongoing ecosystem development. While adoption alone does not guarantee price gains, steady network activity helps support long term value and reduces the risk of sharp breakdowns at current levels.
Bull vs Bear Scenario for Pi Network
- Bull case: If Pi maintains support above $0.20 and network usage continues to grow, a breakout above $0.25 could open the door toward the $0.30–$0.35 range. This scenario depends on stronger adoption, broader exchange access, and a supportive crypto market.
- Bear case: If buying interest weakens and Pi falls below $0.19, downside pressure could push the price toward $0.16–$0.17. In this case, the market would likely remain range-bound until new demand or utility appears.
Pi Network (PI) Monthly Price Projections: 2028
The monthly projections below cover the 2028 forecast range. For 2026, the bull and bear scenarios above provide the key price bands ($0.14–$0.25). The identical figures across all months of 2028 reflect the model’s baseline assumption of steady-state conditions, not a prediction that price will not move month to month. Actual prices will vary based on news, adoption events, and market cycles.
| Month | Minimum Price | Average Price | Maximum Price |
|---|---|---|---|
| January 2028 | $0.247 | $0.300 | $0.353 |
| February 2028 | $0.247 | $0.300 | $0.353 |
| March 2028 | $0.247 | $0.300 | $0.353 |
| April 2028 | $0.247 | $0.300 | $0.353 |
| May 2028 | $0.247 | $0.300 | $0.353 |
| June 2028 | $0.247 | $0.300 | $0.353 |
| July 2028 | $0.247 | $0.300 | $0.353 |
| August 2028 | $0.247 | $0.300 | $0.353 |
| September 2028 | $0.247 | $0.300 | $0.353 |
| October 2028 | $0.247 | $0.300 | $0.353 |
| November 2028 | $0.247 | $0.300 | $0.353 |
| December 2028 | $0.247 | $0.300 | $0.353 |
Pi (PI) price prediction 2030
| Month | Minimum Price | Average Price | Maximum Price |
|---|---|---|---|
| January 2030 | $0.380 | $0.480 | $0.580 |
| February 2030 | $0.380 | $0.480 | $0.580 |
| March 2030 | $0.380 | $0.480 | $0.580 |
| April 2030 | $0.380 | $0.480 | $0.580 |
| May 2030 | $0.380 | $0.480 | $0.580 |
| June 2030 | $0.380 | $0.480 | $0.580 |
| July 2030 | $0.380 | $0.480 | $0.580 |
| August 2030 | $0.380 | $0.480 | $0.580 |
| September 2030 | $0.380 | $0.480 | $0.580 |
| October 2030 | $0.380 | $0.480 | $0.580 |
| November 2030 | $0.380 | $0.480 | $0.580 |
| December 2030 | $0.380 | $0.480 | $0.580 |
Pi Network’s story is unusual in crypto. It built a user base of over 35 million people using a mobile-mining app before listing a single token on any exchange. That gave it a community few projects can match. It also created a supply problem: when mainnet launched, hundreds of millions of PI tokens entered circulation from years of mobile “mining.” The resulting sell pressure from early miners cashing out is a primary reason the price has stayed below $0.30 despite the large user base.
The price trajectory from here depends on one core question: does the Pi Network ecosystem develop enough real use cases — actual apps, transactions, and commerce within the Pi Browser — that holding PI becomes useful rather than purely speculative? If yes, the $0.80–$1.20 range by 2030 is achievable. If it remains primarily speculative, the price may continue to struggle. Watch KYC completion rates, mainnet transaction volume, and major exchange listing activity as the key signals to track. If you trade PI, our crypto capital gains tax guide explains how profits and losses are treated in most jurisdictions.
How much will Pi be worth in 2026?
Based on current market conditions and technical analysis, PI is trading in the $0.14–$0.25 range for most of 2026. The $0.20 level has acted as support. Most model-based forecasts put the average around $0.14–$0.20 for the year. Reaching the upper end of $0.25 requires positive sentiment, broader exchange listings, and continued ecosystem activity. These are model-based estimates; the actual price can differ significantly.
Can Pi reach $10?
Not by 2030 according to any major forecasting model. Reaching $10 would give PI a market cap of roughly $100 billion — larger than most top-ten cryptos have sustained. It would require Pi to become a widely adopted payment and utility network at institutional scale, which current data does not support. Some long-horizon community forecasts cite $10+ as a theoretical maximum, but these are not grounded in transaction volume, adoption metrics, or comparable project analysis.
Will Pi Coin reach $500?
$500 per PI token would require a market cap that exceeds the current value of the entire global crypto market combined. No credible analysis — algorithmic, fundamental, or technical — supports this as a realistic outcome. This type of prediction typically originates from community speculation rather than any analytical framework. Avoid any source that makes this claim seriously.
Can Pi reach $5?
$5 is possible as a long-term ceiling scenario but would require PI to perform in the top tier of all altcoins over a multi-year bull cycle. Specifically: full KYC completion across the user base, meaningful app usage in the Pi Browser ecosystem, major exchange listings including Binance or Coinbase, and a concurrent crypto bull market. Some 2028–2030 bullish scenario forecasts cite $2–$5. These are extreme upside cases, not base cases.
What Is the Risk of Buying Pi Network in 2026?
The key risks for PI holders in 2026 are: ongoing sell pressure from early miners unlocking tokens, uncertain exchange adoption (PI still lacks Binance and Coinbase listings as of early 2026), low proven utility outside speculation, and dependence on the Pi Core Team’s roadmap execution. On the positive side, the large user base is a real asset, and the team has delivered mainnet after years of delay. Anyone buying PI should size their position to reflect the speculative nature of the asset — this is not a stable-value investment.
How Does Pi Network’s Supply Affect Its Price?
PI’s total supply is a major factor in its price ceiling. Pi Network originally had no hard cap, with tokens distributed through mobile mining. The core team has since set a maximum supply of approximately 100 billion PI, with around 7 billion in circulation as of early 2026. This high supply relative to demand is one reason the price per token is low. Even significant demand increases will need to absorb a large supply, which naturally suppresses the price-per-token compared to lower-supply assets like Bitcoin. See our Bitcoin price prediction for a comparison of how supply dynamics differ across assets.