


Last updated: May 30, 2026
- Summary Box
- What Is Bitcoin?
- Where Bitcoin Trades Today
- What Just Happened: The Catalysts Moving Price
- Halving Cycle Position: Where We Are in the Pattern
- ETF Flow Reality Check
- The Bull Case
- The Bear Case
- Analyst Price Targets: 2026 to 2030
- How We Built This Forecast
- The CoinsCipher Bitcoin Price Forecast
- Bitcoin Price Prediction 2030: The Long View
- Why Bitcoin Price Forecasts Systematically Miss
- Key Risks
- Frequently Asked Questions
- Bottom Line
- Why Trust CoinsCipher?
Summary Box
| Metric | Value |
| Current BTC price | $73,194 (May 30, 2026) |
| All time high | ~$118,000 (Aug 2025) |
| Year to date | Down approximately 32% |
| 2026 Bear case | $60,000 to $80,000 |
| 2026 Base case | $95,000 to $120,000 |
| 2026 Bull case | $150,000 to $200,000 |
| 2030 Base case | $400,000 to $600,000 |
| Key bullish catalyst | CFTC approved first US Bitcoin perpetual futures (May 29, 2026) |
| Key bearish catalyst | ETF outflows hit $733M in one day (May 28, 2026) |
Bitcoin is trading at $73,194 today, down 32% year to date and about 38% below its cycle peak of $118,000 set in August 2025. That sentence will feel jarring if you stopped paying attention in early 2025, when BTC was punching through six figures and every prediction desk on Wall Street was racing to revise targets higher. The market has moved. The catalysts have changed. The question on every holder’s mind is whether $73K is the floor of a new accumulation range or the start of something uglier.
What Is Bitcoin?
Bitcoin is a decentralized digital currency created in 2009 by the pseudonymous Satoshi Nakamoto. It runs on a public blockchain validated by a global network of nodes, with no central issuer, no board, and no kill switch. Supply is mathematically capped at 21 million coins, and new issuance halves roughly every four years through an event called the halving. The most recent halving was April 2024, cutting block rewards from 6.25 BTC to 3.125 BTC.
That supply schedule is the single most important fact about Bitcoin as an asset. Nothing else in macro finance has it. Demand can swing wildly. Supply does not.
Where Bitcoin Trades Today
BTC sits at $73,194 as of May 30, 2026, with a market cap near $1.33 trillion and circulating supply around 19.85 million coins. The asset remains the largest crypto by market cap, ahead of Ethereum at roughly $233 billion. Year to date, Bitcoin is down about 32%. From its all time high above $118,000 in August 2025, it is down roughly 38%.
The price action through May 2026 has been heavy. BTC opened the month above $80,000, briefly touched $82,000 on May 6, then bled lower through every week that followed. The slide accelerated after May 27 on a combination of geopolitical escalation and the largest single day ETF outflow since January.
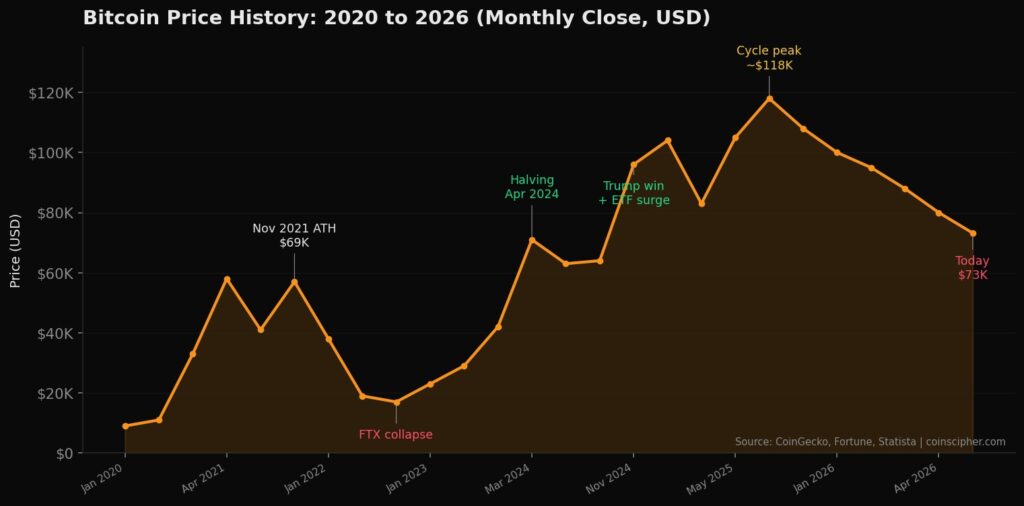
Bitcoin price history showing the 2024 to 2025 cycle peak and the 2026 drawdown to current levels. Source: CoinGecko, Fortune, Statista.
Whether this is a drawdown inside a still intact cycle or the start of a deeper bear phase depends on what you make of the catalysts driving it.
What Just Happened: The Catalysts Moving Price
Three things matter right now. One is bullish, two are bearish, and they are all live.
1. CFTC approved the first regulated US Bitcoin perpetual futures contract.
On May 29, 2026, the US Commodity Futures Trading Commission approved Kalshi to list the BTCPERP contract, a perpetual futures product tied to Bitcoin’s spot price. It is the first time a perpetual contract on Bitcoin has been listed on a regulated US exchange. CFTC Chairman Mike Selig called it a “major step forward” and tied it directly to the administration’s stated goal of making the US the crypto capital of the world.
Why this matters: perpetual futures account for the majority of global crypto derivatives volume, but until last week, US traders had to access them through offshore exchanges. Onshoring this market under federal oversight is a structural shift, not a short term catalyst. The CFTC also issued separate guidance allowing Coinbase Financial Markets to expand US customer access to global perpetuals through its Deribit affiliate. Two doors opened in one day.
2. Bitcoin ETFs hit their largest outflow day since January.
On May 27 and 28, US spot Bitcoin ETFs recorded combined outflows exceeding $1 billion, with BlackRock’s IBIT alone bleeding $528 million on May 28. That was the second largest single day outflow in IBIT’s history. The selling came after weeks of slowing inflows and growing institutional caution. Net ETF inflows year to date have collapsed from the pace seen in 2025 (SoSoValue dashboard).
3. The US Iran conflict escalated.
The war involving the US, Israel, and Iran that broke out in February 2026 spiked through May, taking crypto down with broader risk assets. Bitcoin briefly traded below $73,000 on the escalation, finding support at a heavy buy wall around the $70,000 level.
The catalysts are pulling in opposite directions. Regulation is opening up. Institutional flows are pulling back. Geopolitics is amplifying everything.
Halving Cycle Position: Where We Are in the Pattern
The single most cited Bitcoin thesis is the halving cycle. The data tells a more complicated story than the bulls usually admit.
Bitcoin has had four halvings: 2012, 2016, 2020, and 2024. Each one was followed by a bull cycle peak, but the magnitude of returns has shrunk dramatically with every cycle.
- 2012 cycle: Halving price ~$12, peak ~$1,150 in November 2013. Return: ~9,500%.
- 2016 cycle: Halving price ~$650, peak ~$20,000 in December 2017. Return: ~2,900%.
- 2020 cycle: Halving price ~$8,700, peak ~$69,000 in November 2021. Return: ~640%.
- 2024 cycle: Halving price ~$63,000, peak so far ~$118,000 in August 2025. Return so far: ~87%.
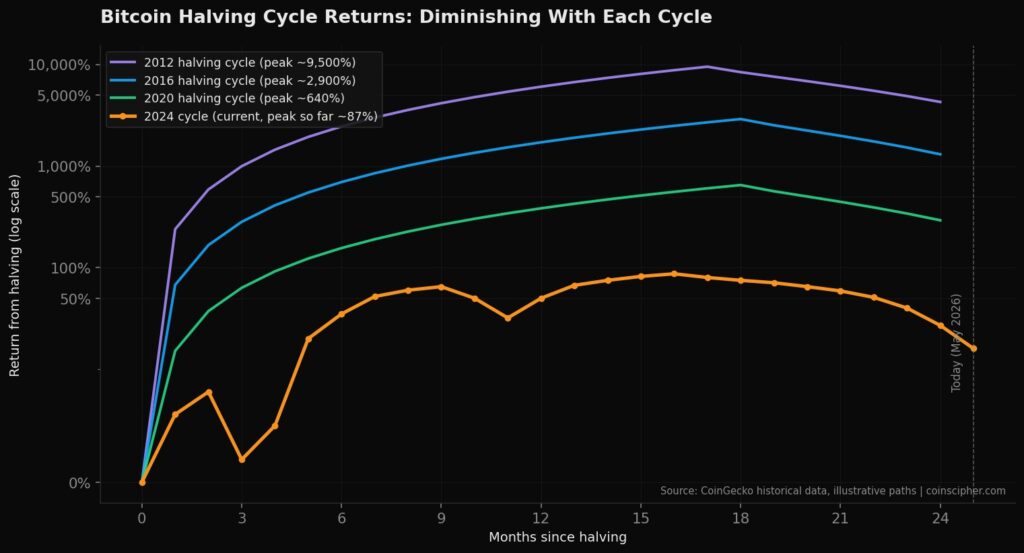
Returns from the halving date, by cycle. Each cycle has produced smaller percentage gains as the asset matures. Source: CoinGecko historical data.
The math is straightforward. As Bitcoin gets bigger, the marginal dollar required to move price grows non linearly. A $1 billion buy moved BTC meaningfully in 2013. It barely shows up on the chart in 2025.
We are now 25 months past the April 2024 halving. Historically, cycle peaks have arrived 12 to 18 months post halving. The August 2025 high at $118,000 sits inside that window. By the historical pattern, we are in the post peak phase already.
That is the bearish read of the cycle data. The bullish counter is that ETF distribution and policy adoption are extending the cycle structurally, pushing the eventual peak further out into 2026 or 2027. Both interpretations are defensible. Neither is certain.
ETF Flow Reality Check
Spot Bitcoin ETFs are the single most important demand variable in this cycle. They launched in January 2024 and accumulated assets at a pace that no ETF in history has matched. At peak in April 2026, US spot BTC ETFs held roughly $145 billion in AUM. Today that number sits closer to $137 billion after May’s outflows.
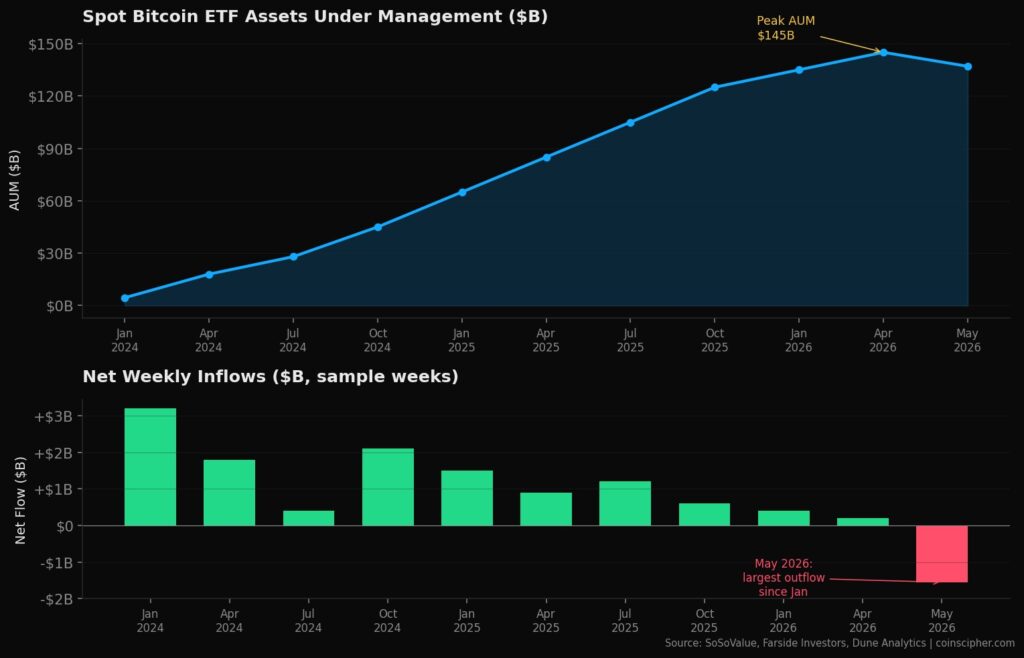
Spot BTC ETF cumulative AUM (top) and net weekly flows (bottom). The May 2026 outflow week was the largest since January 2026. Source: SoSoValue, Farside Investors.
Two facts to sit with.
First, in April 2026, US spot Bitcoin ETFs absorbed approximately 19,000 BTC over a nine day stretch. That was nine times the new BTC mined in the same window. When institutional demand consistently runs at multiples of new supply, the math gets uncomfortable for sellers fast.
Second, ETF flows have flipped from a steady tailwind to a clear headwind. The current trend is six consecutive sessions of net outflows totaling over $1.5 billion. Bitwise’s head of research André Dragosch told DL News, “2026 is going to be an amazing year for Bitcoin and cryptoassets,” citing the year three thesis: that gold ETFs saw their largest inflows in year three, not year one or year two, as wealth manager distribution finally opens up.
That thesis is testable in the next two quarters. If outflows continue through July, the year three argument breaks. If flows reflip and a major wirehouse opens BTC access to client portfolios, it confirms.
The Bull Case
The bull case rests on three pillars: supply, distribution, and policy.
Supply. The April 2024 halving cut new BTC issuance to roughly 450 coins per day. Multiple institutional and treasury buyers are absorbing more than that on average. Less coin sits on exchanges than at any point since 2018. The float is genuinely tightening.
Distribution. Spot Bitcoin ETFs entered their third year of existence in January 2026. Year one brings the early adopters, year two brings cautious institutional pilots, and year three is supposed to bring wealth manager distribution that puts BTC on Main Street portfolios. The mechanism is RIAs and broker dealers finally clearing internal approval to allocate client capital to spot BTC.
Policy. The CFTC perpetuals approval is one signal. A second is the Strategic Bitcoin Reserve bill in Congress, which proposes accumulating up to 1 million BTC for the US government over five years. The bill is not yet law, but the fact that it is being debated openly is a meaningful shift from where the conversation was eighteen months ago.
If all three pillars hold, the bullish forecasts for $150,000 to $250,000 by year end are not crazy. They are conditional.
The Bear Case
The bear case is simpler and does not require anything to break. It only requires the current trend to continue.
ETF inflows have slowed to a trickle, and outflow days now outnumber inflow days. The macro backdrop is hostile: an active war, sticky inflation, and a Federal Reserve slower to cut rates than crypto bulls priced in. Institutional conviction surveys still show 75% of respondents view BTC as undervalued at current levels, but conviction has not translated into buying. It has translated into waiting.
Below $73,000, the next technical support is around $65,000. Below that, the prior bull market high near $69,000 from 2021 becomes the line in the sand. If $65,000 breaks with volume, several analyst models project a drop into the high $50,000s.
The bear case does not require a recession or a banking crisis. It only requires the current ETF outflow streak to extend another month or two while macro stays bad.
Analyst Price Targets: 2026 to 2030
The professional forecasting spread on Bitcoin is enormous. Treat this as the range of opinion, not the menu of likely outcomes.
| Source | 2026 Range | 2027 Outlook | Long Term Target |
| Bernstein | $150,000 year end | $200,000 cycle peak | Not modeled |
| Fundstrat (Tom Lee) | $250,000 high end | Bullish continuation | Not modeled |
| Standard Chartered | Bullish | Bullish | $500,000 by 2028 |
| Cathie Wood (Ark) | Bullish | Bullish | $1.5 million by 2030 |
| Pantera (Dan Morehead) | Bullish | Bullish | Up to $740,000 by 2029 |
| Jack Dorsey | Bullish | Bullish | $1 million by 2030 |
| Brad Garlinghouse (Ripple) | $180,000 in 2026 | Bullish continuation | Not modeled |
| InvestingHaven | $125K to $225K | $100K support floor | $200K+ before 2030 |
| Coinpedia | $100K to $180K | Bullish | Not modeled |
| CoinCodex | $74K to $93K | $74K to $93K | $153K to $210K (2031) |
| Changelly | $77K to $83K year end | $55K to $130K | $153K to $210K |
| LiteFinance (bearish) | $58K to $79K | $57K to $165K | $173K to $174K |
| Coinbase (5% model) | $76K | $77K | $94K (2031) |
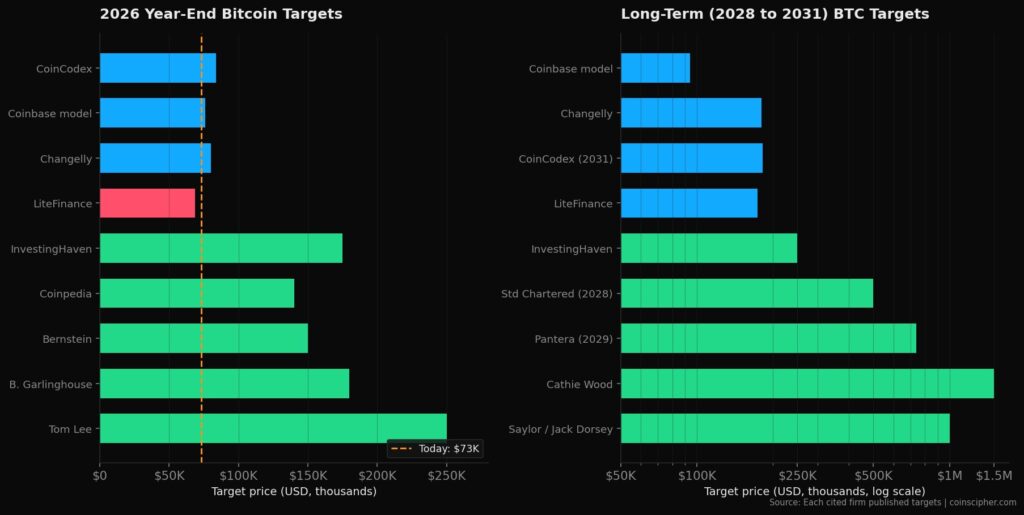
2026 year end targets (left) and long term 2028 to 2031 targets (right). The spread reflects fundamental disagreement on adoption trajectory. Source: Each cited firm published targets.
The range tells you something important. The bearish algorithmic models cluster around current levels. The bullish institutional desks cluster between $150K and $250K for year end. The long term targets from Wood, Saylor, Dorsey and Pantera reach into seven figure territory by 2030.
That spread tells you the fundamental setup is contested. Anyone selling certainty is selling a story, not analysis.
How We Built This Forecast
CoinsCipher’s projections combine six inputs. The relative importance of each factor changes over time, with ETF flows, macro liquidity, and institutional adoption currently carrying the greatest weight.
We place greater emphasis on ETF flow data than prior-cycle models because spot Bitcoin ETFs have fundamentally altered Bitcoin’s market structure since January 2024.
- Historical halving cycle data. Cycle position relative to the April 2024 halving and the diminishing return pattern observed across the 2012, 2016, and 2020 cycles.
- Spot ETF flow trends. Daily and weekly net flows across BlackRock IBIT, Fidelity FBTC, and the broader spot ETF complex, tracked via SoSoValue and Farside Investors.
- Federal Reserve policy expectations. Rate path probabilities from CME FedWatch and dollar liquidity conditions including DXY and real yields.
- Bitcoin supply issuance. Post halving daily mining issuance measured against demand absorption by ETFs, public company treasuries, and exchange outflows.
- Institutional adoption metrics. Public company BTC treasury holdings, sovereign reserve activity, and wealth manager distribution signals.
- Historical drawdown analysis. Comparable cycle drawdowns and recovery times, scaled to current market capitalization.
Forecasts are scenario based and updated monthly. Each scenario includes the conditions required for it to play out, allowing readers to track whether the thesis is strengthening or weakening over time.
The CoinsCipher Bitcoin Price Forecast
Based on the data above, here is what CoinsCipher projects. Every number is conditional on stated assumptions. If the assumptions break, the numbers break.
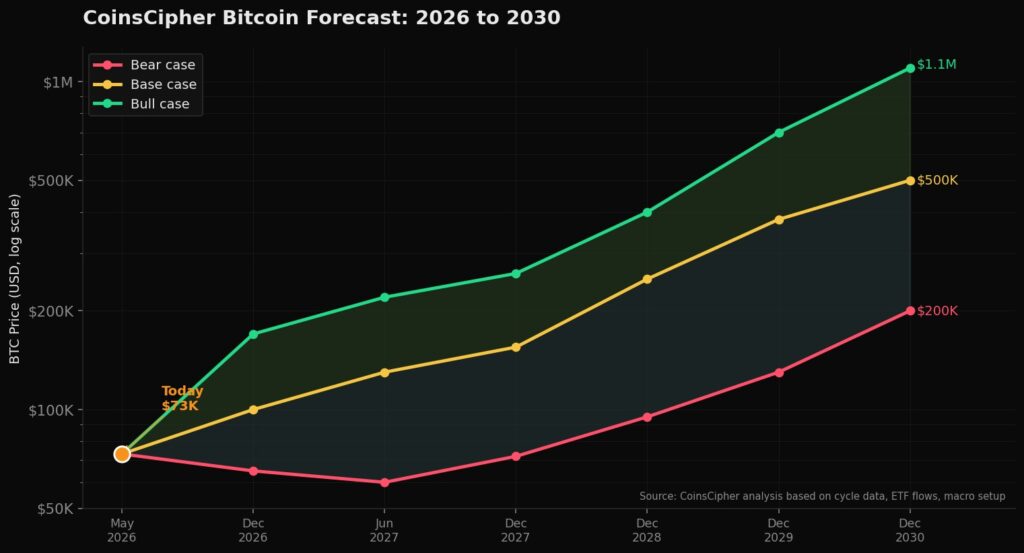
Three scenarios from May 2026 through December 2030. Source: CoinsCipher analysis based on cycle data, ETF flows, and macro setup.
Bear Case: $60,000 to $80,000 by year end 2026
Triggers required:
- ETF outflow streak extends through Q3 with no reversal
- US Iran conflict escalates further into a broader regional war
- Federal Reserve holds rates restrictive through year end
- Strategic Bitcoin Reserve bill dies in committee
- $65,000 support breaks with conviction
In this scenario, BTC tests $58K to $60K mid year, then consolidates in a $65K to $80K range into December. The 2027 outlook stays heavy, with BTC ranging $70K to $100K through the year. The 2030 outlook is a slow grind back to $200K as the long term ETF distribution thesis plays out anyway, just on a slower timeline.
Base Case: $95,000 to $120,000 by year end 2026
Triggers required:
- ETF flows reflip to net positive by Q3 2026
- Iran conflict stabilizes or de escalates
- Federal Reserve cuts rates at least once
- Strategic Reserve bill remains an active legislative item
- BTC reclaims $80K resistance with volume
In this scenario, BTC recovers above the prior all time high but does not blow it out. The 2027 cycle peak window delivers $130K to $180K, broadly aligned with Bernstein’s target. By 2030, the base case projects $400K to $600K, predicated on continued institutional adoption and BTC capturing roughly 5 to 10 percent of gold’s market capitalization equivalent.
Bull Case: $150,000 to $200,000 by year end 2026
Triggers required:
- All base case factors plus
- Strategic Bitcoin Reserve bill passes or advances meaningfully
- Major wealth manager opens BTC allocation to client portfolios at scale
- Risk on macro environment with multiple Fed cuts
- ETF flows return to 2024 peak pace
In this scenario, BTC closes 2026 between $150K and $200K, aligned with Tom Lee, Bernstein, and Brad Garlinghouse forecasts. The 2027 cycle peak reaches $200K to $280K. By 2030, the bull case projects $800K to $1.2 million, requiring sovereign reserve adoption and currency debasement narratives to play out at scale.
What this forecast is not
These are scenario ranges, not single point predictions. The current data justifies a base case centered around $105K by year end 2026, with meaningful probability mass on both sides. If we had to pick a single number, it would be that. But pretending we can pick the right one is exactly the prediction theater this article is designed to avoid.
Bitcoin Price Prediction 2030: The Long View
Long term Bitcoin forecasts depend on three adoption assumptions that compound on each other.
Assumption 1: ETF AUM growth. US spot BTC ETFs sit at roughly $137 billion AUM today. If they grow at half the pace of the first two years through 2030, AUM reaches $400 billion to $500 billion. That alone would absorb a meaningful share of new supply for the next four years. The bull case requires faster growth, with international ETF launches in major markets pushing combined AUM toward $1 trillion by decade end.
Assumption 2: Sovereign reserve allocation. If even three to five mid sized countries hold BTC as a reserve asset by 2030, the structural buyer base shifts permanently. The Strategic Bitcoin Reserve bill in the US is the bellwether. El Salvador’s holdings are an existing data point but small in absolute terms. The bull case requires this trend to compound, with several nation state holders accumulating quietly.
Assumption 3: Treasury asset adoption. MicroStrategy was the original public company treasury BTC holder. The bull case requires this to become a default capital allocation strategy for a meaningful share of the S&P 500, not a fringe choice by a few CEOs. The 2024 to 2025 cycle saw real progress here, with multiple Fortune 500 companies announcing BTC treasury policies. The next three years will determine whether this scales or stalls.
If all three assumptions land, the $500K to $1M+ targets by 2030 from Wood, Saylor, Pantera and Dorsey are mathematically possible. If only one or two land, the realistic range is $250K to $500K. If none land convincingly, BTC consolidates as “digital gold lite” at $150K to $250K.
CoinsCipher’s base case for 2030 is $400K to $600K, assuming Assumption 1 hits and Assumptions 2 and 3 partially hit.
Why Bitcoin Price Forecasts Systematically Miss
Reason 1: ETFs broke the cycle math. Every cycle model built before January 2024 assumed Bitcoin’s price was driven by retail flows, miner selling, and macro liquidity. ETFs introduced a buyer with different time horizons, different rebalancing logic, and different cost basis than the rest of the market. Models calibrated on pre ETF data systematically underestimated the late 2024 rally and now systematically miscount the May 2026 drawdown.
Reason 2: Geopolitics is unmodelable. No analyst priced in the US Iran war that broke out in February 2026. No analyst priced in the Trump election’s effect on crypto policy. No analyst priced in the Strategic Reserve bill. These are sources of variance that models cannot capture and that even the best analysts can only react to after the fact.
Reason 3: The halving cycle is changing shape. As shown above, the magnitude of post halving returns has fallen by an order of magnitude each cycle. Whether the 2024 cycle follows the pattern (with a peak well below 2021 levels in relative terms) or breaks the pattern (with ETF distribution extending the cycle into 2026 or 2027) is the single biggest question in the asset right now. Anyone forecasting confidently is guessing.
Reason 4: Liquidity is path dependent. A small handful of large holders (ETFs, MicroStrategy, large miners) can move the market at scale. Their decisions are not in any public model. The largest single day IBIT outflow in May 2026 was a $1.29 billion block trade by one entity. That kind of action determines short and medium term price, and it is invisible until after it happens.
The takeaway: every Bitcoin price forecast, including ours, is wrong about the specific number. The value of a forecast is the framework, not the target.
Key Risks
A few things that could break the bull thesis entirely.
- Macro shock. A serious recession, a major liquidity event, or escalation of the US Iran war into a broader conflict would pull risk assets down hard. Bitcoin has decoupled from equities at the margin, but in a true crisis, correlations go to one.
- Regulatory reversal. The CFTC perpetuals approval lacks formal rule status and could be reversed by future agency leadership. A hostile administration after the next election cycle could roll back the gains made in 2025 and 2026.
- ETF outflows accelerate. If the current outflow trend extends, the structural buyer that defined the 2024 to 2025 cycle becomes a structural seller. Bitcoin’s market microstructure has changed because of the ETFs. That cuts both ways.
- Quantum or protocol risk. Distant but real. A meaningful breakthrough in quantum computing or a critical flaw in Bitcoin’s cryptography would not give the market time to react.
- Concentration risk. As ETFs and corporate treasuries accumulate more of the supply, BTC becomes more sensitive to a small number of large holders’ decisions. A few coordinated sellers could move the market in ways that retail driven cycles never did.
Frequently Asked Questions
What will Bitcoin be worth in 2026?
CoinsCipher’s base case is $95,000 to $120,000 by year end 2026, conditional on ETF flows reflipping positive, the Iran conflict stabilizing, and at least one Fed rate cut. Bearish models including LiteFinance forecast $58K to $79K. Bullish institutional desks including Bernstein and Fundstrat forecast $150K to $250K. The range reflects genuine disagreement.
Can Bitcoin reach $100,000 again in 2026?
Yes, plausibly. BTC reached $118K in August 2025, so $100K is within the recent trading range. Recovery would require ETF flows turning positive, geopolitical stability, and at least one Fed rate cut. None of these are extreme requirements.
Will Bitcoin hit $200,000?
Possibly, with conditions attached. $200K is roughly the Bernstein 2027 target and the high end of the 2026 bull case. It requires policy tailwinds (Strategic Reserve advancement, wealth manager distribution), macro tailwinds (Fed cuts, risk on), and continued ETF accumulation. It is the bull case, not the base case.
Is Bitcoin a good investment in 2026?
This depends on your time horizon and risk tolerance, neither of which CoinsCipher can assess for you. The structural drivers (capped supply, ETF distribution, policy tailwinds) remain intact. The cyclical drivers (ETF outflows, geopolitical risk, macro tightness) are real headwinds. Sizing matters more than timing.
What factors affect Bitcoin price the most?
In order of current impact: ETF flows, macro liquidity (Fed policy and dollar strength), regulatory developments, geopolitical events, and on chain dynamics (exchange balances, halving cycle position). Retail sentiment, which used to dominate, now plays a smaller role than at any time in Bitcoin’s history.
When is the next Bitcoin halving?
The next halving is expected in April 2028, four years after the April 2024 event. Block rewards will fall from 3.125 BTC to 1.5625 BTC.
What is the maximum supply of Bitcoin?
Bitcoin’s maximum supply is hard capped at 21 million coins. As of May 2026, approximately 19.85 million coins are in circulation, meaning over 94 percent of all Bitcoin that will ever exist has already been mined.
Should I buy Bitcoin now?
CoinsCipher does not give buy or sell recommendations. What we can say is that BTC at $73K sits between the bearish algorithmic models and the bullish institutional desks. The data supports neither a confident buy nor a confident sell call. If you make a directional bet, do it with sizing that survives being wrong.
Bottom Line
Bitcoin in May 2026 is at a junction, not a verdict. The structural drivers that made the 2024 to 2025 cycle work, halving math, ETF distribution, policy tailwinds, are still in place. The cyclical headwinds, ETF outflows, geopolitical risk, macro tightness, are real and they are pressing.
If you held BTC through 2022 and 2023, you have seen worse than this. If you bought near the top in late 2024 or early 2025, the current price feels like a betrayal. Neither feeling is analysis.
CoinsCipher’s base case is $95K to $120K by year end 2026 and $400K to $600K by 2030. The exact outcome is uncertain. What matters is how the key drivers evolve. The framework, scenario probability shifts based on ETF flow trajectory, Iran conflict resolution, and Fed policy, will be right. Track the variables, not the targets.
If you want to make a directional bet, do it with sizing that survives being wrong. That has always been the trade.
Why Trust CoinsCipher?
CoinsCipher updates its Bitcoin forecast monthly using ETF flow data, macroeconomic indicators, and on chain metrics. Historical forecasts remain publicly archived for transparency, so readers can verify our track record over time rather than taking the current forecast on faith.
Sources: CoinGecko, CoinMarketCap, Fortune Bitcoin Price Tracker, CFTC.gov, CoinDesk on CFTC Approval, Dune Analytics Bitcoin ETF Tracker, DL News on ETF Year Three, CoinCodex, Changelly, Coinpedia, XS.com Analyst Roundup, Kraken Price Prediction Tool, Statista Bitcoin Price Index.

I’m Eric Nkando, a crypto and crypto tax enthusiast, with other extensive experiences in forex and stock markets. I believe crypto and blockchain are no longer alien topics and I’m here to help investors tackle emerging issues of taxation and prudential investment strategies. My approach? Delivering clear, insightful analysis on digital assets, market trends, and trading strategies, bridging complex technical concepts with practical investment perspectives. My work has been widely published on leading financial platforms such as Investing.com, FXLeaders, and The Distributed.